Horse Racing Draw Bias – Which UK Courses Favour High or Low Stalls
 Available in US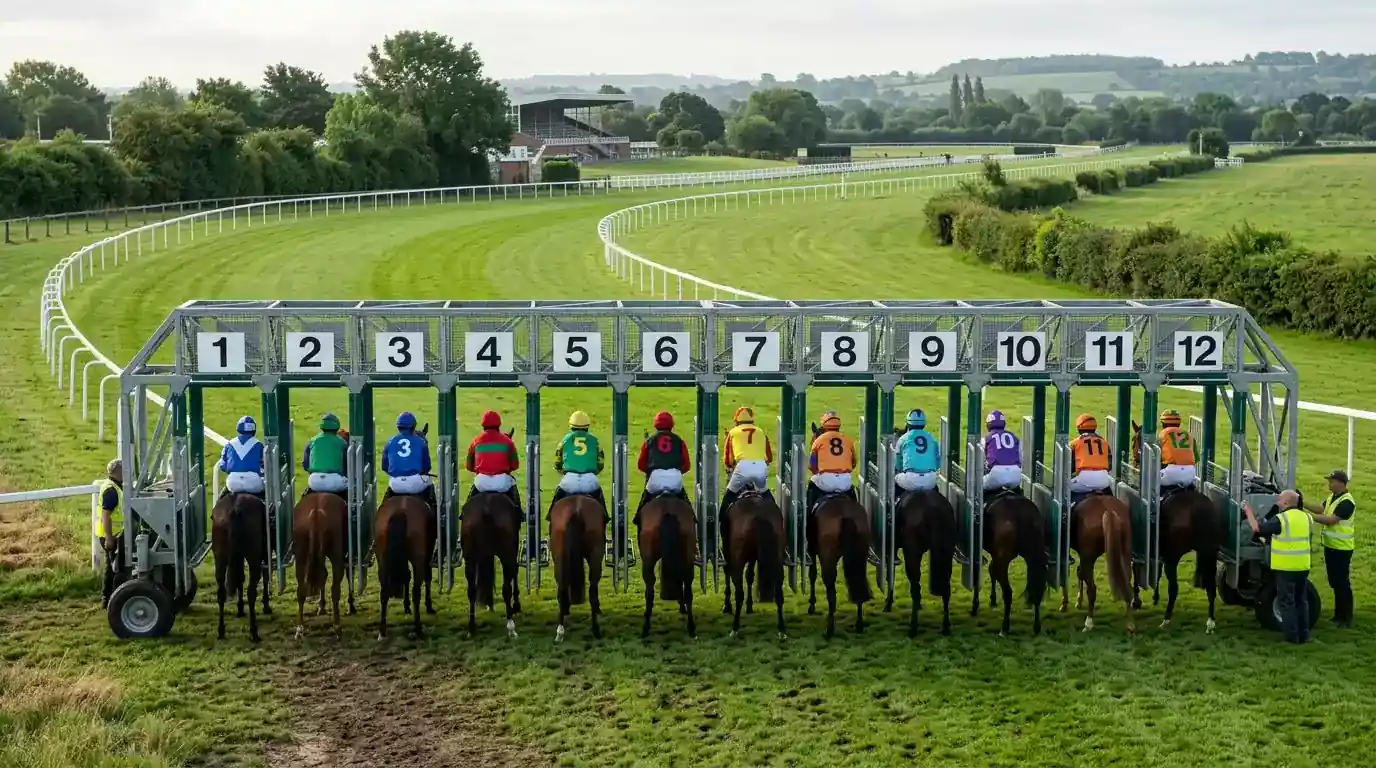
Chester, October 2021. I backed a beautifully handicapped horse at 7/1 in a seven-furlong handicap. It was drawn in stall 12 of 12, on the outside of a tight left-handed track where the running rail is everything. The horse ran a blinder – finishing third – but never had a realistic chance from that draw. The two that beat it had stalls 1 and 3. That afternoon cost me money, but it cemented a principle I’ve followed since: at certain racecourses, the draw isn’t a factor to consider. It’s the factor.
Why Draw Bias Exists – Track Shape, Rail, and Going
Draw bias is a product of track geometry and racing physics. On straight courses, the bias typically comes from ground conditions – one side of the track may be fresher, better drained, or closer to the running rail. On bends, the bias is geometric: a horse drawn on the inside of a turn covers less distance than a horse drawn on the outside. Over five or six furlongs, where margins are measured in fractions of a length, the extra ground covered from a wide draw translates directly into lost positions.
Across the UK’s 59 licensed racecourses, the strength of draw bias varies enormously. Some courses – Beverley, Chester, Thirsk, Catterick – have consistent, well-documented biases that persist across seasons. Others – Newbury, Haydock, Doncaster – have minimal bias under normal conditions but can develop temporary biases when the ground turns soft or the rail is repositioned.
The going is the primary variable that activates or neutralises draw bias on straight courses. On good to firm ground at Ascot’s straight mile, the draw is relatively neutral. On soft ground, the side of the track that drains better – often determined by camber, proximity to water courses, and recent weather patterns – can produce a dramatic advantage. Clerks of the course sometimes move the running rail to distribute wear more evenly, and this repositioning can flip the bias entirely.
Wind direction is an overlooked factor. On exposed courses like Newmarket or Goodwood, a crosswind can create a bias by offering shelter to horses on the lee side of the track. This is a transient bias that doesn’t appear in historical statistics but can dominate on the day.
High-Bias UK Courses and Their Key Distances
Chester is the UK’s most extreme example of draw bias. The tight, left-handed, almost circular track measures barely a mile around, which means every race of six furlongs or more involves bending. Low draws – stalls 1 to 4 – have a massive statistical advantage because they can hold the inside rail through the turn and cover significantly less distance than wide-drawn rivals. The bias is so strong at Chester that many professional punters eliminate high-drawn horses from contention entirely.
Beverley’s straight course produces a different kind of bias. The track has a noticeable camber, and in sprints – five furlongs and six furlongs – one side of the course consistently rides faster than the other. The favoured side shifts depending on the going: high draws (stands side) tend to be favoured on faster ground, while low draws can come into play on softer going. The data is consistent enough across multiple seasons to be a reliable betting tool.
Thirsk, another tight track, favours low draws in sprint races for the same geometric reasons as Chester, though the effect is less extreme. Catterick’s downhill five furlongs produces a bias toward low draws, partly because the inside rail offers the shortest route down the slope and partly because the track’s drainage creates ground variations that favour certain paths.
Goodwood is the most complex case. The course undulates, bends right, and has a straight that runs uphill. Draw bias at Goodwood depends on the specific distance, the position of the running rail (which is moved frequently), and the going. In some configurations, high draws dominate the six-furlong sprint. In others, low draws are favoured. The bias requires daily analysis rather than blanket rules, which makes it both the most challenging and the most rewarding course for draw-bias study.
At courses like Newmarket’s Rowley Mile, the one-mile straight is wide enough that draw bias is generally minimal. The July Course is slightly different – the straight course has some camber that can create a modest bias, particularly on extreme ground. Favourites win about 33% of all UK races, but at courses with strong draw bias, favourites drawn on the wrong side win significantly less often – which opens up value on less obvious horses drawn favourably.
Using Draw Data in Your Race Assessment
Incorporating draw bias into your pre-bet analysis doesn’t require complex statistics. The approach I use is a three-step filter. First: is this a course where draw bias matters? If it’s a round course with no straight races (like Pontefract) or a wide, galloping track (like Newbury), the draw is a minor factor and I move on. If it’s Chester, Beverley, or any of the bias-heavy courses, the draw becomes my first consideration.
Second: what are the conditions today? Check the going report and the rail position. A course that favours low draws on good ground might be neutral or favour high draws on soft ground. The historical bias is a starting point, not a conclusion – it needs to be calibrated against the day’s specific conditions.
Third: how strong is the bias at this specific distance? A course might have a strong draw bias at five furlongs and virtually none at a mile. Sprint distances amplify draw advantages because there’s less time to recover from a positional disadvantage. Over longer distances, the bias attenuates because the pace is slower and horses have more time to find their position.
The practical application is straightforward. If a horse I fancy is drawn badly at a high-bias course, I either reduce my stake significantly, switch to a different horse with a better draw, or skip the race entirely. The form book might say one thing, but the draw can override it. Being willing to pass on a race because of an unfavourable draw is one of the most profitable disciplines a Flat racing punter can develop.
When the Draw Trumps Everything Else
There are specific race types where the draw is more important than form, going preference, or class. Large-field handicaps over five and six furlongs at bias-heavy courses are the clearest example. In a 20-runner sprint handicap at Beverley, the difference between stall 1 and stall 20 can be worth several lengths – more than the handicapper’s weight adjustments are designed to equalise.
Heritage handicaps at Ascot – the Wokingham, for instance – are another case where the draw regularly determines the result. Punters who identify the favoured side early on the day and focus their selections accordingly have a structural edge over those who ignore the draw and back on form alone.
The willingness to let the draw dictate your betting on specific days at specific courses is what separates draw-aware punters from the rest. It feels wrong to dismiss a well-fancied horse because it’s drawn in stall 15, but the data supports exactly that approach at the right time and the right course. The draw is not a tiebreaker. At its most influential, it’s the primary selection criterion.
Does draw bias exist in National Hunt racing?
Draw bias in National Hunt racing is negligible. Jump races start from a tape or flag rather than stalls, and the longer distances involved give horses ample time to settle into their preferred positions regardless of starting position. The only exception is in National Hunt Flat races (bumpers) at tight courses, where the inside berth from a standing start can offer a minor advantage. For hurdle and chase races, the draw is not a factor.
How do I find draw statistics for a specific UK racecourse?
Free draw data is available on several racing analysis websites and in the Racing Post’s course guides. These sources typically show the win percentage by stall group (low, middle, high) for each course and distance combination, along with the number of races in the sample. For the most reliable data, look for samples of at least 100 races at the specific course and distance. Paid form databases offer more detailed draw analysis broken down by going, field size, and rail position.
Written by the editors at Horse Racing Game Betting.